| User Manual - Volume Menu |
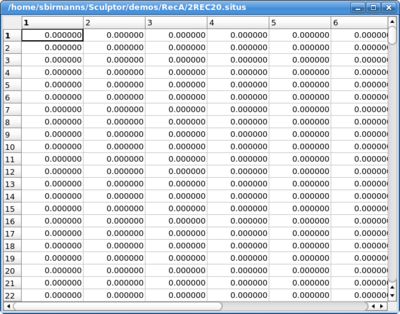
TableThe table shows directly the content of the volume in form of a spreadsheet:
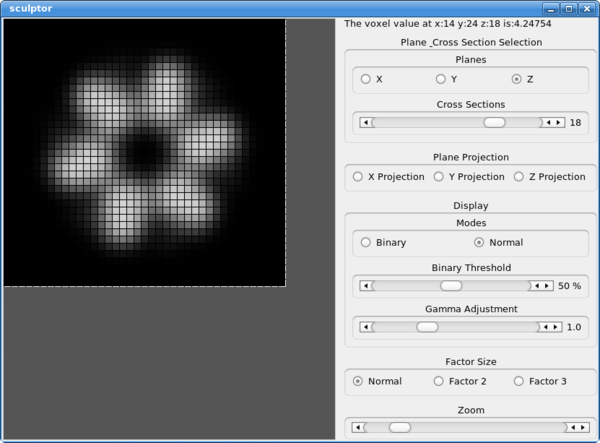
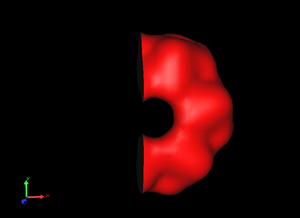
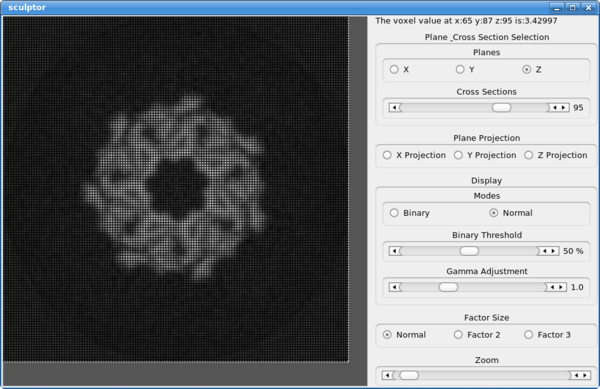
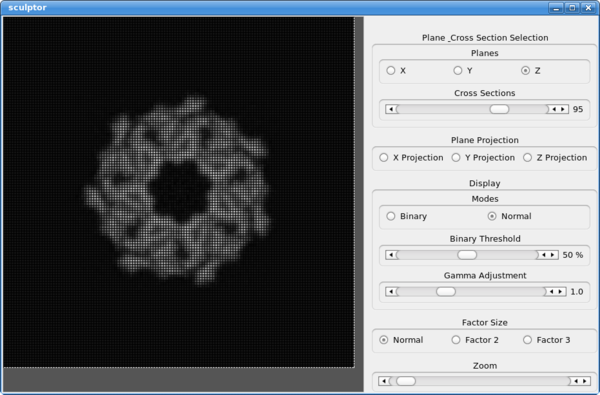
This allows a direct inspection of the voxel values, useful for example to determine if a file was read-in properly. MapExplorerThe MapExplorer is a 2D map exploration tool. It shows cross-sections through the volumetric data:
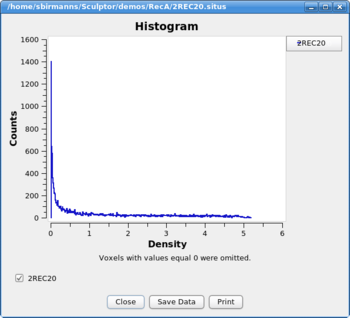
Planes: Select if cross-sections along the X, Y or Z axis are shown. Cross Section: The X (or Y or Z) coordinate of the cross-section can be adjusted. The mouse-wheel can be used to change the cross-section if mouse cursor is within the 2D graphics part of the MapExplorer. Plane Projection: Instead of showing an individual slice one can also display a full projection along X, Y or Z axis. Modes: In Binary mode each voxel is displayed either black or white. The threshold over which a voxel is shown white can be set with the slides "Binary Threshold". Gamme Adjustment: The relationship between the numerical value of a voxel and its brightness on the screen can be adjusted with the slider. Factor Size: Map can be shown in a smaller fashion by averaging multiple voxels and showing them as one. Useful for very large maps which cannot be rendered efficiently using the MapExplorer. Zoom: Visual size of the voxels. HistogramShows the histogram of the voxel values:
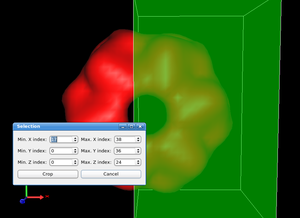
The histogram can be printed or saved as text-file to disk. Occupied VoxelsCalculates the number of voxels over a certain threshold. Change VoxelsizeChanges the physical size of the voxels (in Angstroem). Change OriginChanges the physical position of the origin (in Angstroem). NormalizeNormalizes the voxel-values to [0...1]. ThresholdApplies a minimum and maximum threshold. All voxel values below the minimum are set to the threshold (and analog for the maximum). ScaleScales the voxel values by a given factor. This operation will not scale the volume in size - only the voxel values are scaled. CropCrops the volumetric map. All remaining parts of the volume are covered by a green semitransparent box. With the dialog box one can set the size of the box to the region one would like to keep.
Left: Setting the region to be cropped, Right: Result
FloodfillThe floodfill tool starts filling the volume data from a specific starting point. All voxels connected to the starting point which are higher than a threshold value are kept. The resulting mask can be convolved with a Gaussian kernel to smoothen the edges and to avoid hard step like boundaries. If the sigma of the Gaussian is set to 0, the mask will not be smoothed.
Example: Map before floodfill
Map after floodfill:
The floodfill algorithm has removed the background noise but has left the actual system unaltered. GaussianApplies a Gaussian (smoothing) kernel with a certain width to the map. LaplacianApplied a Laplacian (edge detection) kernel to the volumetric map. Cross-Correlation
|
 Calculates the cross-correlation coefficient (CCC) between to
volumetric maps. Please select two overlapping maps in the document
list and click on the menu "Volume->Cross Correlation" to calculate
the CCC between the data sets.
Calculates the cross-correlation coefficient (CCC) between to
volumetric maps. Please select two overlapping maps in the document
list and click on the menu "Volume->Cross Correlation" to calculate
the CCC between the data sets.