| Tutorial - Peak Search with "Interactive Global Docking" |
|
More information about this interactive peak exploration approach can be found in the following article:
Jochen Heyd and Stefan Birmanns,
Obtaining exhaustive search data"Interactive global docking" (IGD) is an immersive peak search technique for exploring the results of an exhaustive search based multi-resolution docking run performed with Situs / colores. Instead of inspecting dozens or even hundreds of solutions by hand, the user can interactively explore the docking landscape by moving the atomic probe structure through the low resolution volumetric data set. This tutorial covers all the main features of IGD, using a simulated data set as an example. Make sure to specify the '-sculptor' option when using colores, so that the program automatically generates the necessary files (the option is available in Situs 2.5 and higher). For details, please see the Situs documentation on how to carry out exhaustive search docking runs (correlation-based docking tutorial). For this tutorial we will use a small heat shock protein RecA.
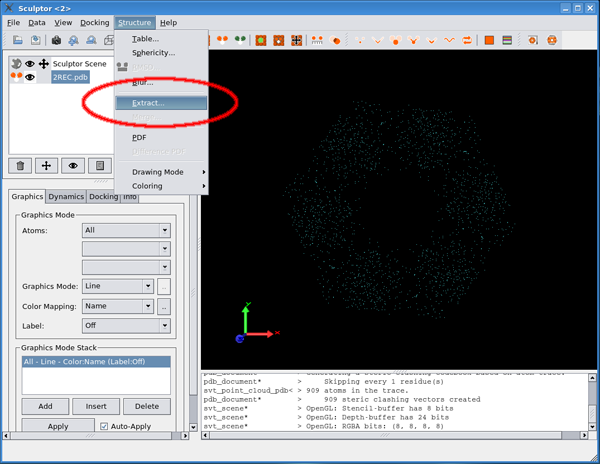
In the menu, select “Structure -> Blur...”
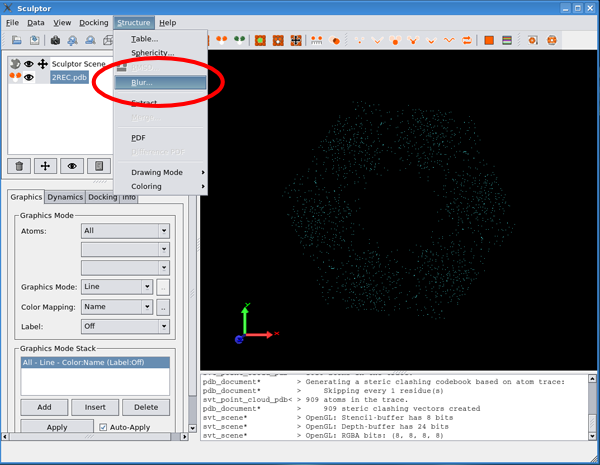
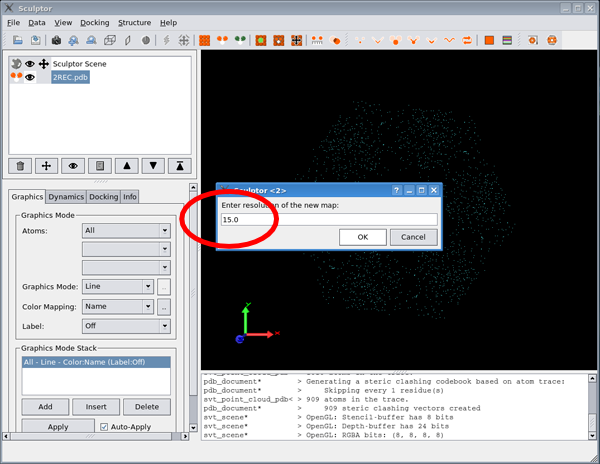
Choose a resolution of 15A
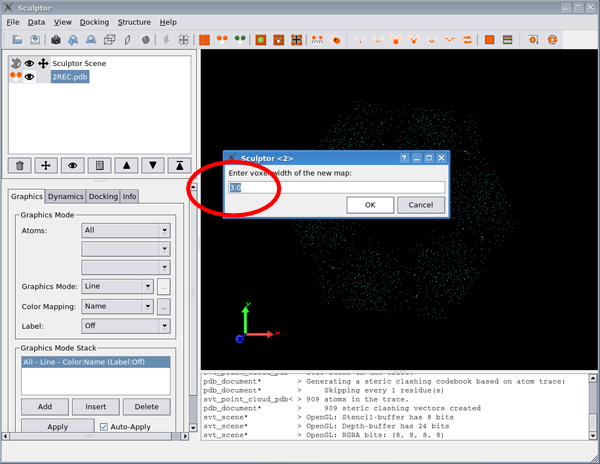
and a 3A voxel size
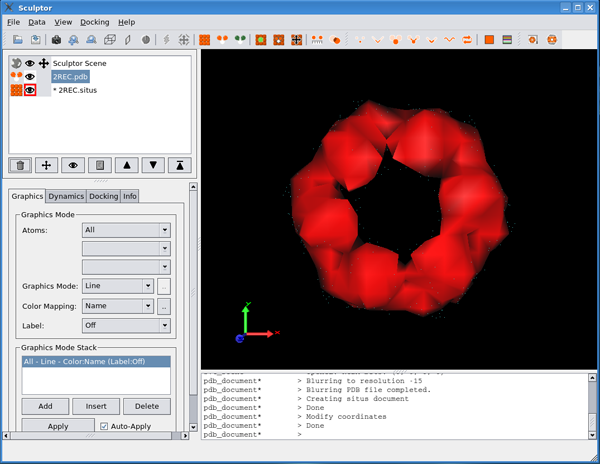
Sculptor will blur the structure and generate a new document with the simulated volume data set:
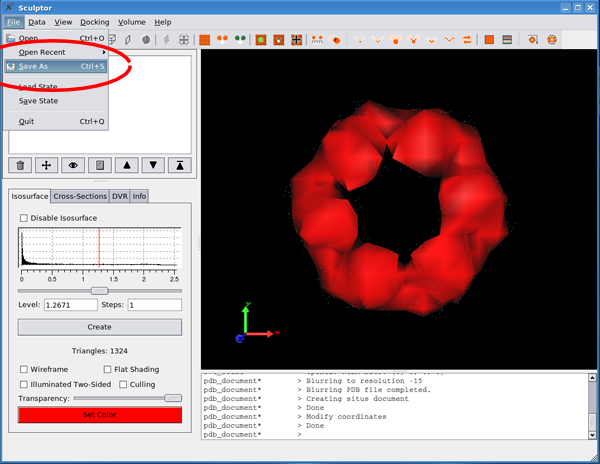
Now, save the document by selecting it and choosing “File -> Save As” from the menu:
Save it under the name '2REC.sit' . Click here to download file.
This generates a map called ‘2REC.sit’ with
3.0A voxel width and 15.0A resolution. Now, we need to extract one
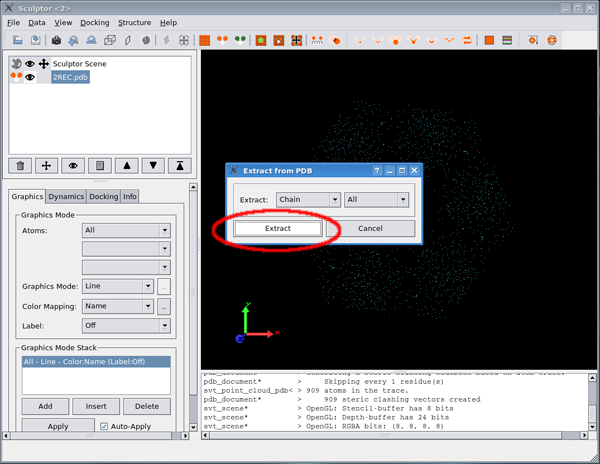
monomer to use as the probe structure. This can be done using a text
editor or via the ‘extract’ functionality of Sculptor. For
the latter approach, start Sculptor using
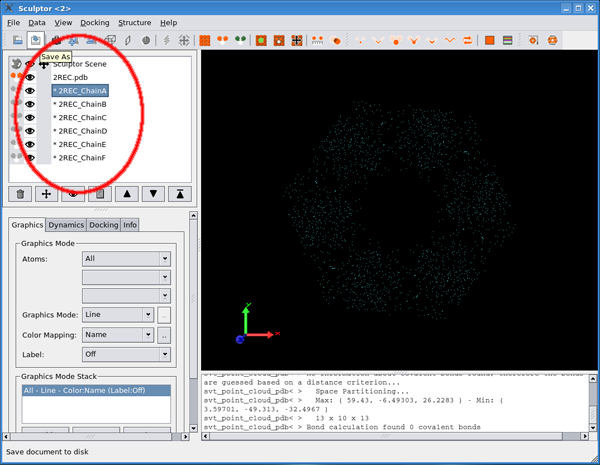
Now, we have the monomers as individual documents
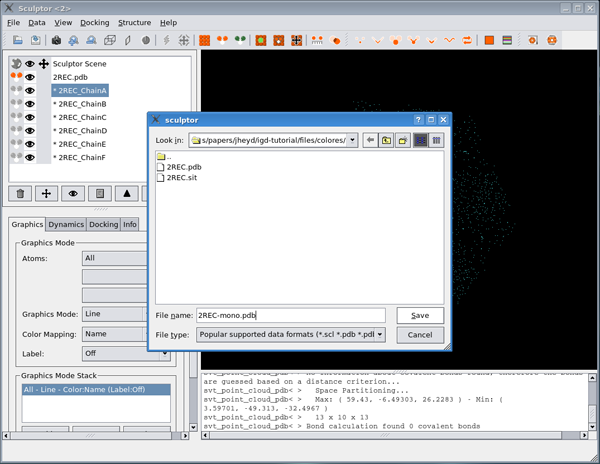
and can save chain A to a file:
Click here to download the file.
This generates a simulated map with 3.0A voxel width and 15.0A
resolution, which can be used to perform an exhaustive search in
Colores: Click here to download the file.
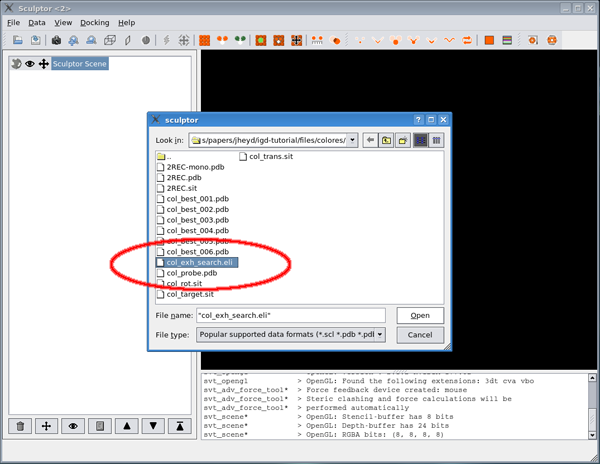
Loading exhaustive search data into SculptorThe exhaustive search data sets comprise several files. Colores will generate the files in the current directory (i.e. where the best_fit* solutions and other output files appear).
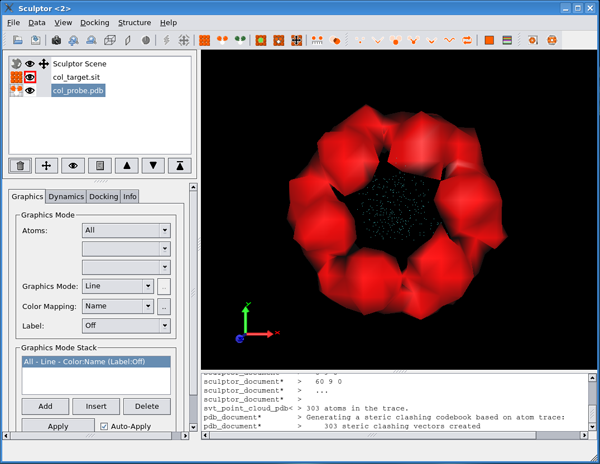
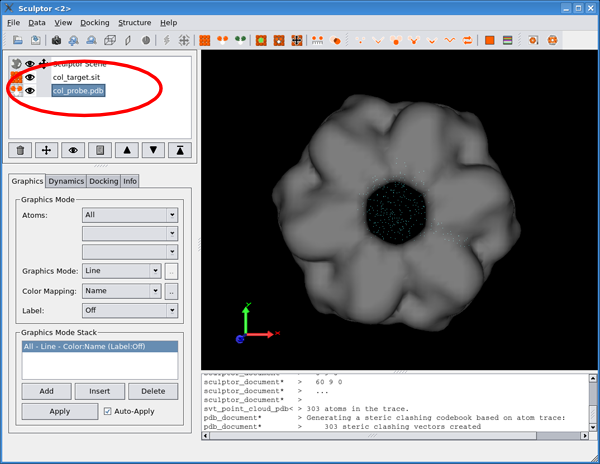
Sculptor then loads the full data set and displays the target map and the probe structure:
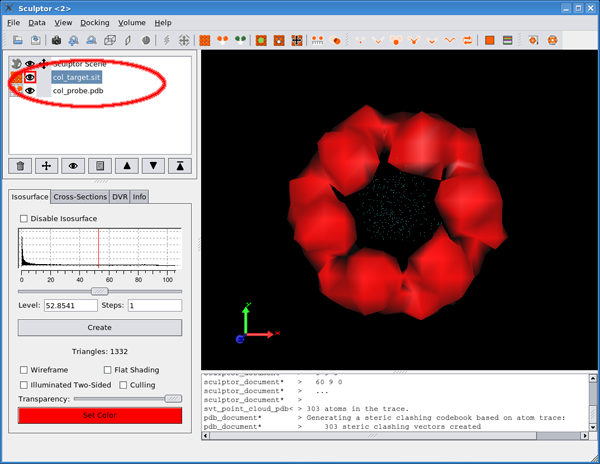
Recommended display propertiesBefore starting the actual docking, it is convenient to first set up all the display options. Select the map in the document panel
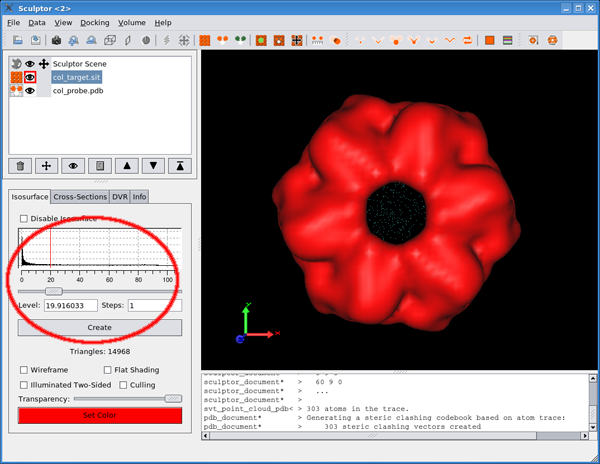
Now click into the histogram to select a lower iso-surface value (here we used 20).
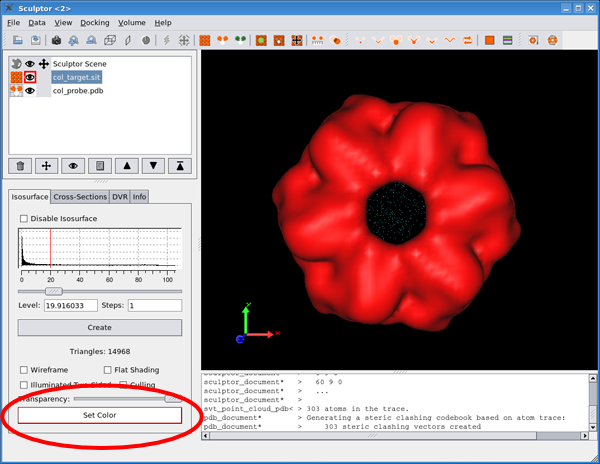
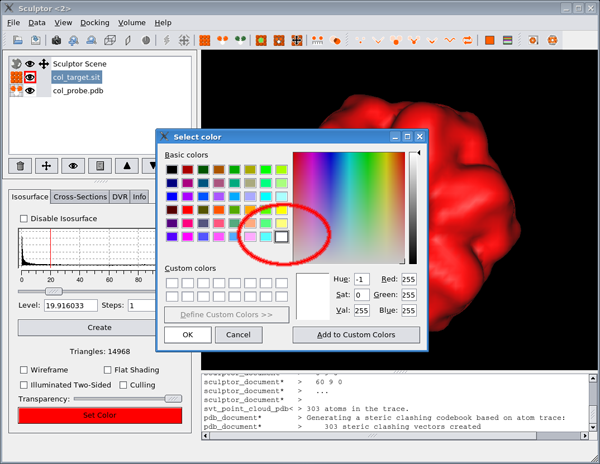
Next, open the color chooser dialog via the “Set Color” button
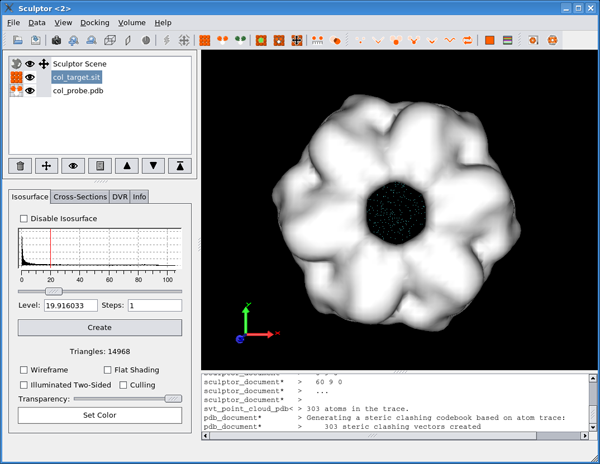
and select white.
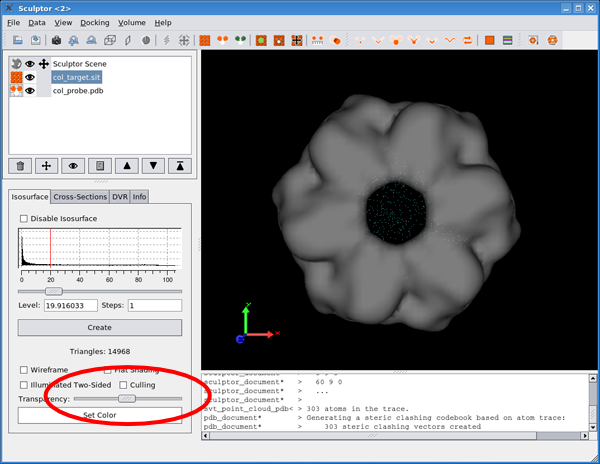
To enable us to see the probe structure inside the map, we now need to lower the transparency of the iso-surface:
Next, select the probe structure.
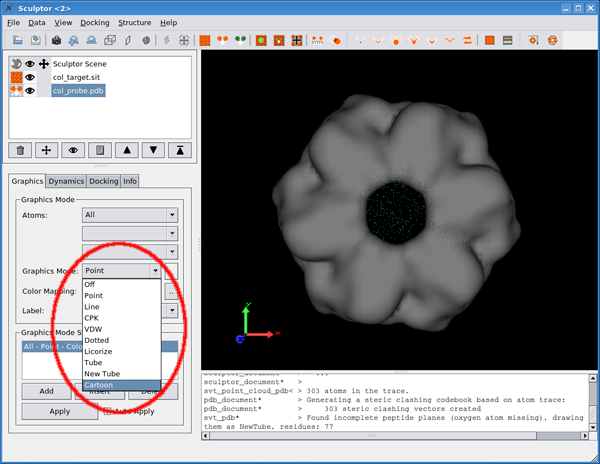
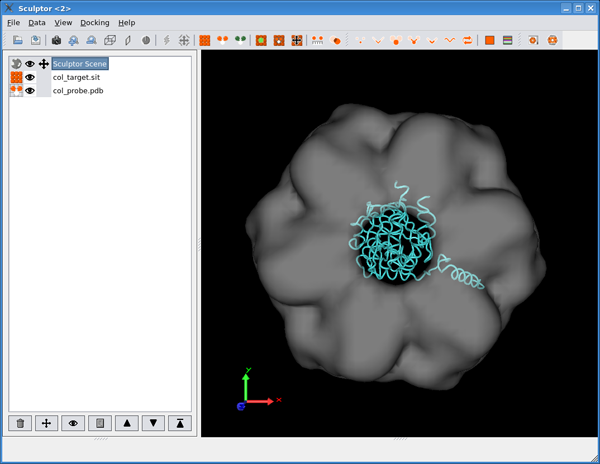
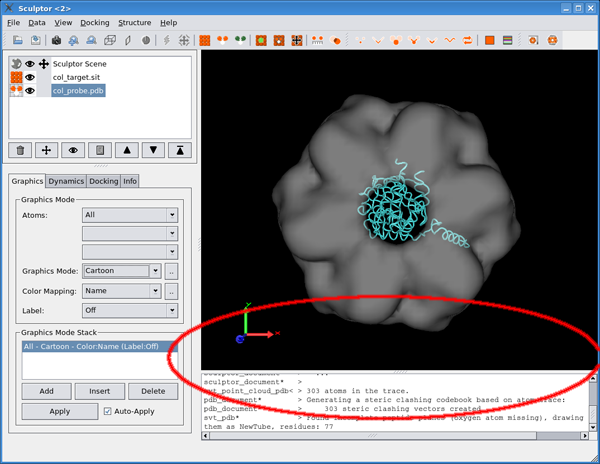
Change its rendering mode to “Cartoon”.
and then either dragging down the properties window on the left or by double clicking on any document name.
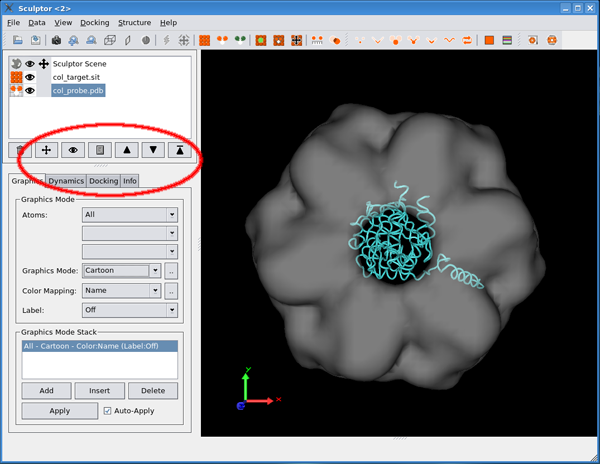
Having done all the setup work, now is a good time to save a scene file.
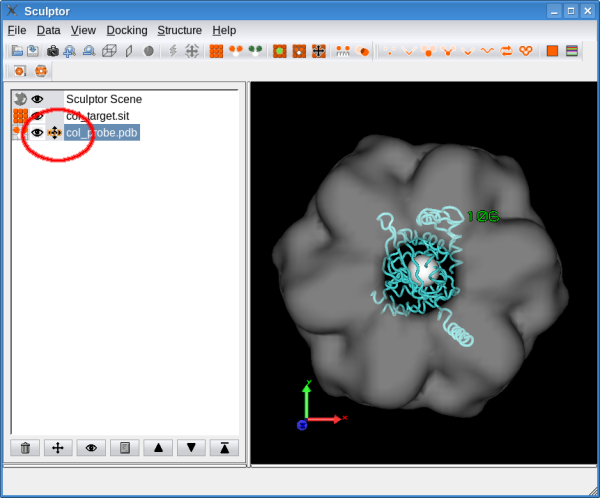
Exploring the docking landscapeTo start the Interactive Global Docking (IGD), just select the probe structure with the move tool.
Since IGD automatically reorients the probe, the left mouse button is used for X and Y translations and the middle button (or wheel press) is performs Z translations.
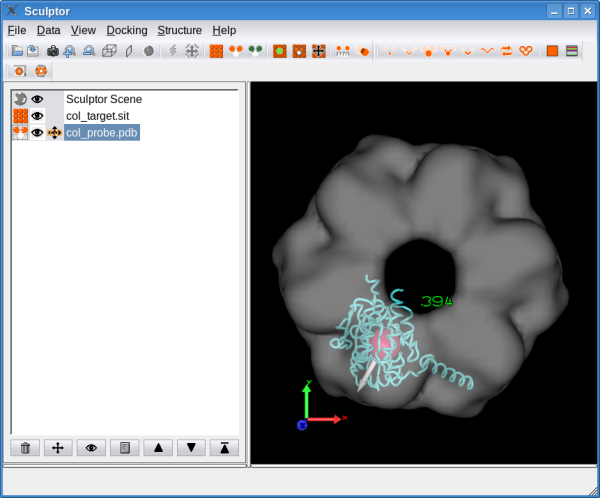
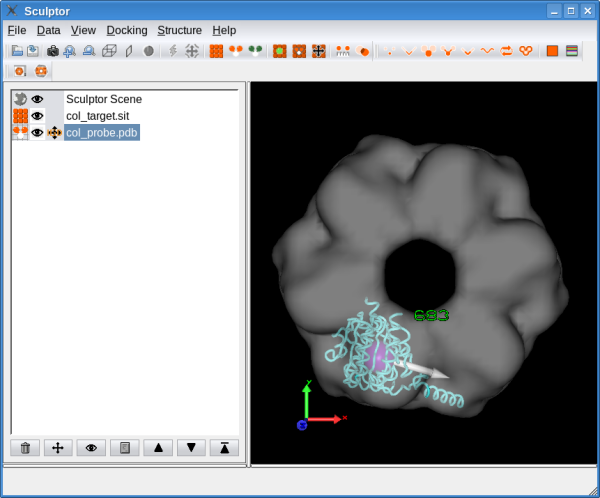
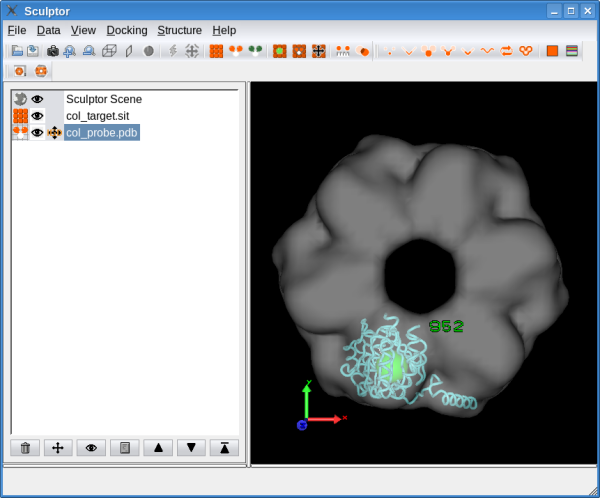
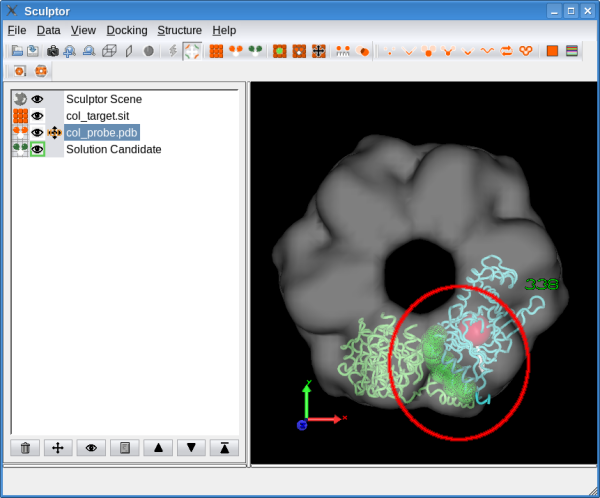
As the structure is moved, the current cross-correlation (CC) score is displayed both numerically and via the color of the central sphere. An arrow points towards regions of higher CC scores and its size scales with the gradient of the CC landscape.
Local maxima in the scoring landscape are highlighted via a wireframe around the central sphere:
We are looking at three criteria when docking the first structure:
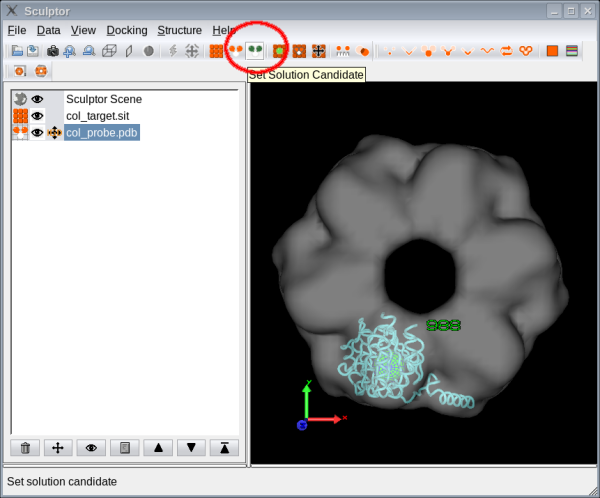
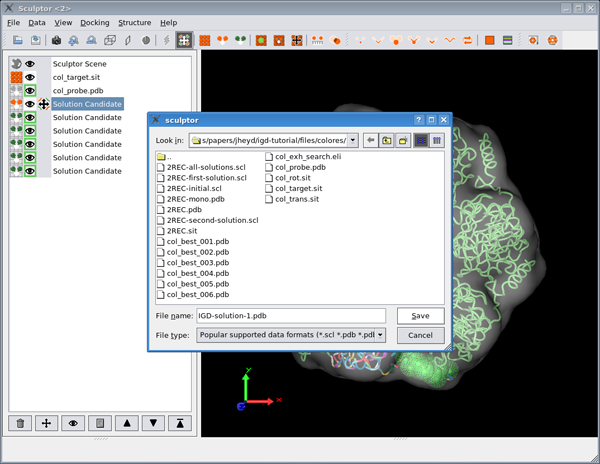
The last criterion is the one which sets IGD apart from other docking techniques. Besides a good fit with the density map, one can also check known or suspected positions of certain residues by highlighting these residues in the probe structure. Remembering solution candidatesHaving found a good initial position for one monomer, we can now save it as a candidate solution. This is accomplished either via:
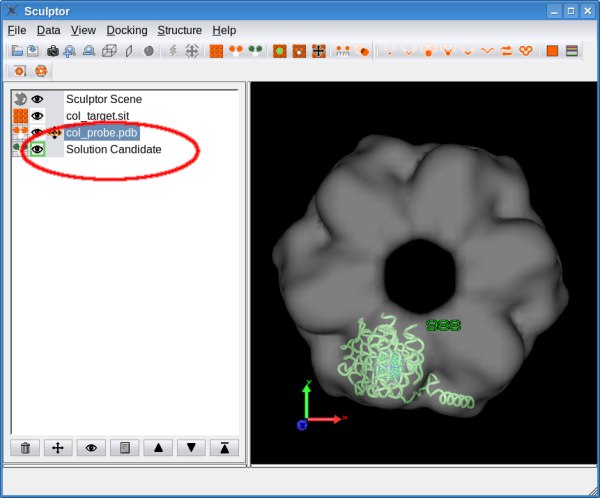
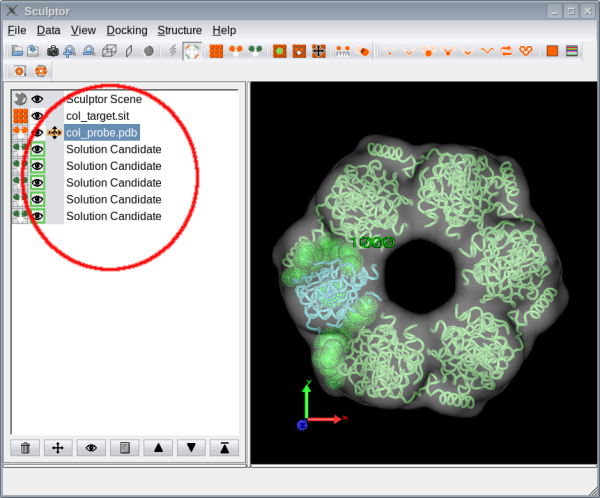
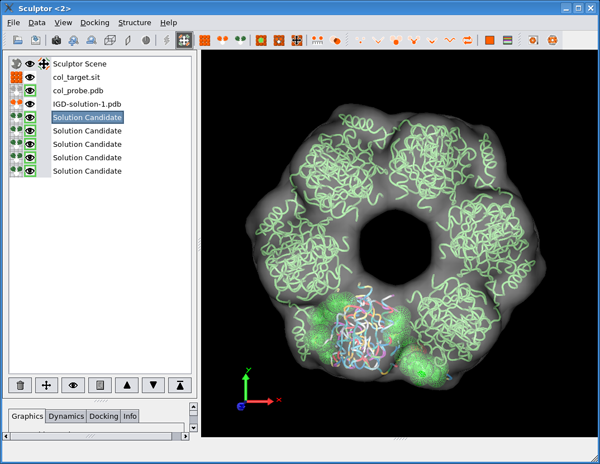
or B) double-clicking the probe icon in the document list, or the keyboard shortcut ‘x’. This adds a new document with a green icon to the list, signifying a solution candidate.
As can be seen in the next screen shot, the solution candidate structure is colored green to make it readily identifiable in the main display window.
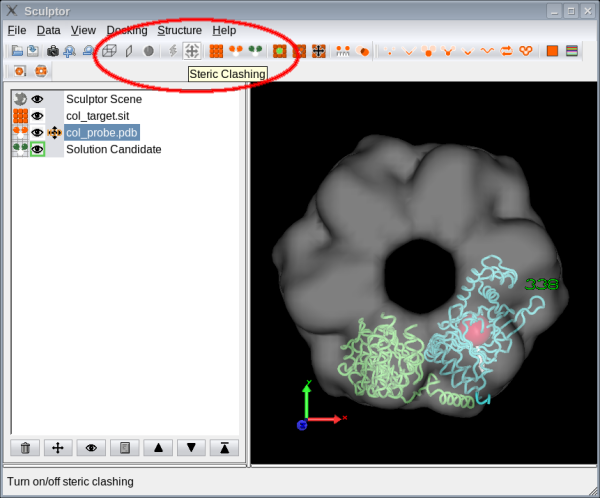
Visualizing potential protein-protein interactionsTurn on steric clashing via the tool bar button
or with the keyboard shortcut ‘c’.
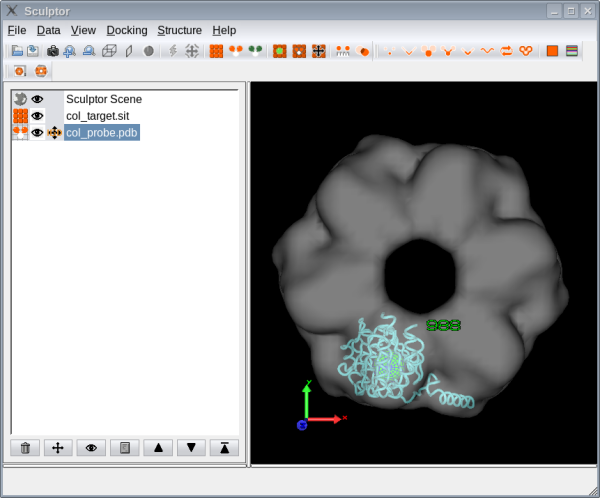
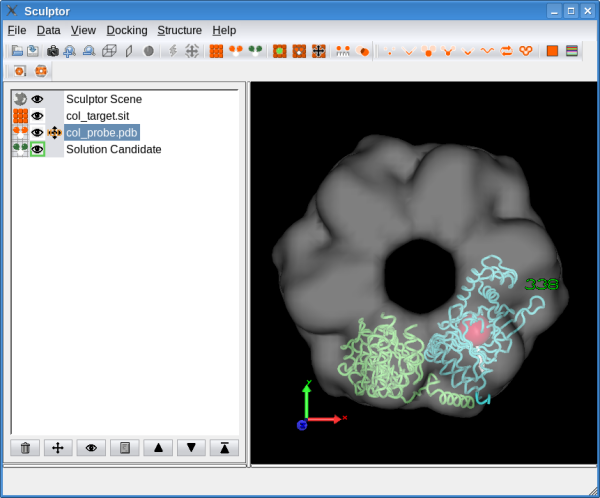
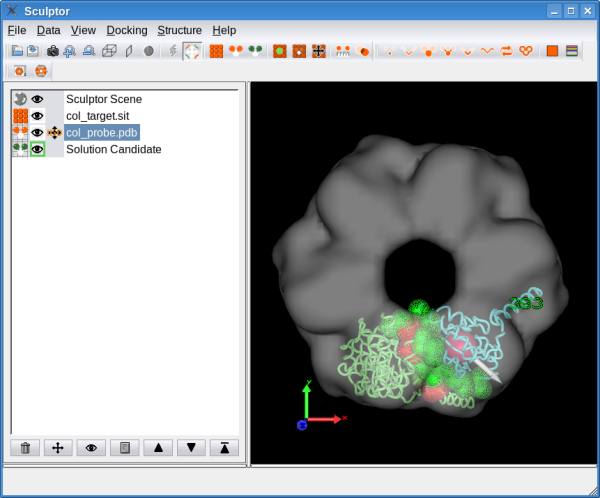
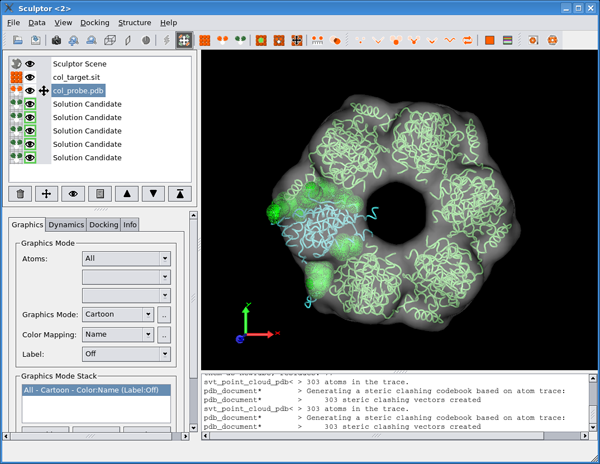
The toolbar icon will be activated and the move tool also changes to signify that steric interactions are being calculated. Favorable backbone-backbone distances are highlighted with green spheres while clashes are shown in red:
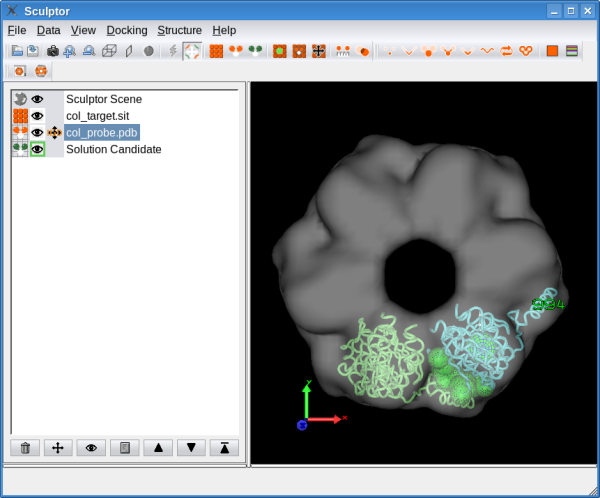
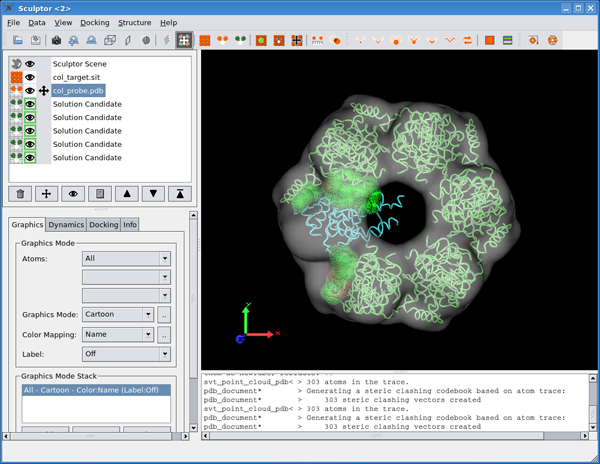
Using the steric information as an additional guide, we obtain the following position for the second monomer:
Now, we can easily place the remaining monomers.
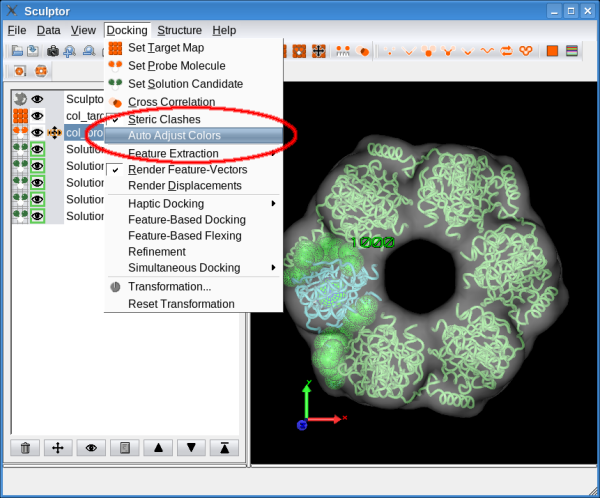
Interactive adjustment of candidate solutionsTypically, IGD is an iterative process where candidate solutions are first placed approximately and later adjusted using steric interactions as a guide. To simplify this task, Sculptor supports rapid switching between the probe and solutions. The color scheme of the original probe can be set to follow the currently active structure. To enable this feature, select “Auto Adjust Colors” from the docking menu:
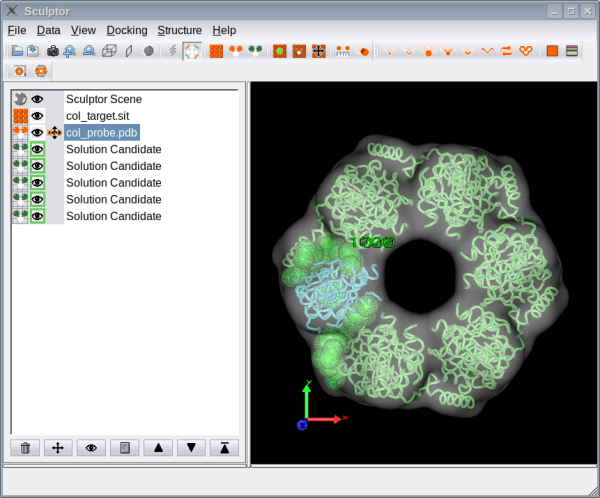
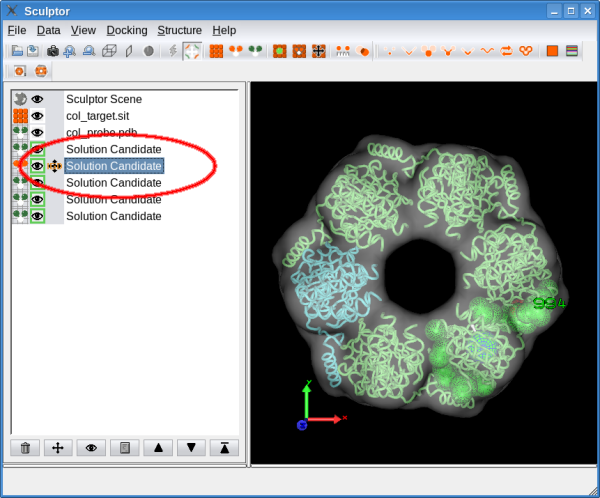
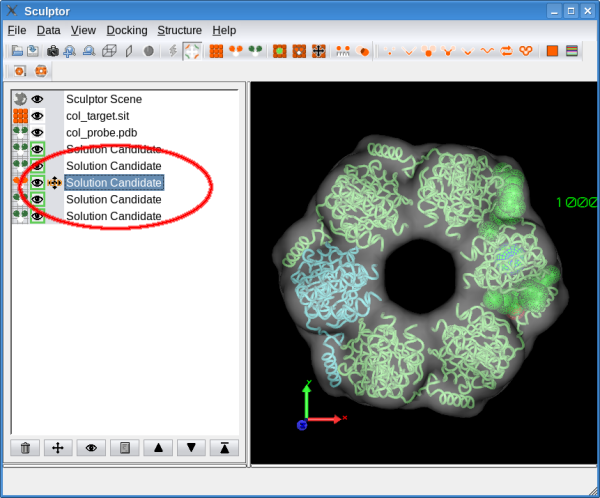
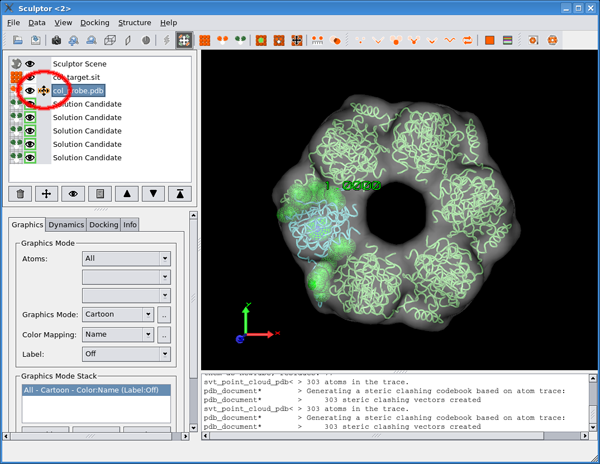
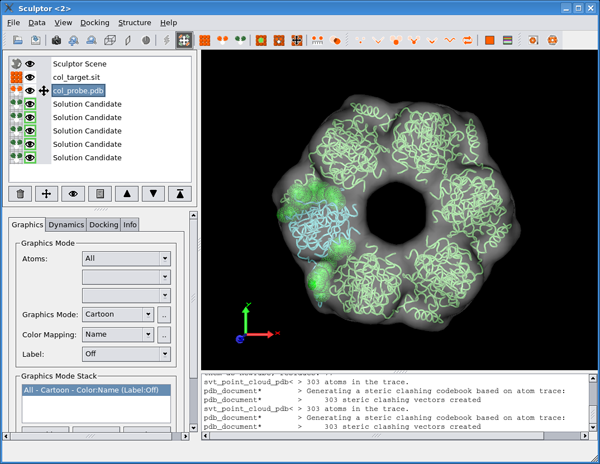
Now, any solution can be selected and the previous probe structure will become a green solution and the solution candidate will become the probe. The new probe structure will be displayed using the color scheme of the old one. As an example, color the probe by residue name:
Now, when we switch to a solution, the currently moved solution will be shown in the residue name coloring scheme.
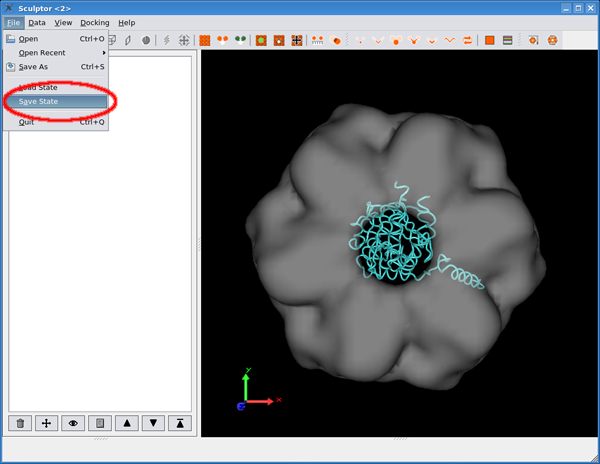
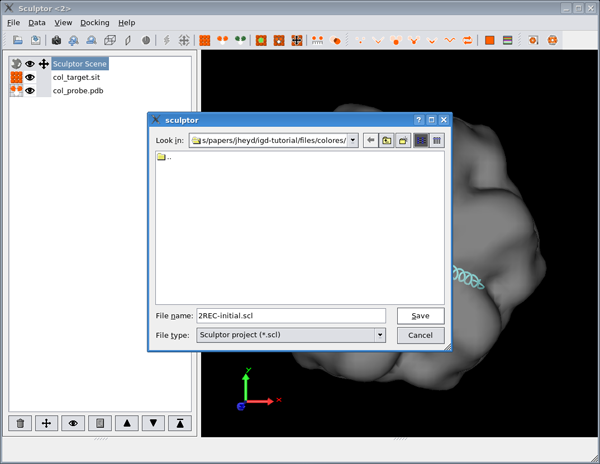
Saving your workAs you build up your list of candidate solutions, it is prudent to save a scene file periodically. Please go to File->Save State to save the current state of Sculptor into a single file. The scene file stores all locations and properties of the candidate solutions (but not the actual experimental data! Please always move the model and structure files together with the scene file and do not change their location relative to each other). Once all subunits have been placed satisfactorily, they can be saved as normal PDB files.
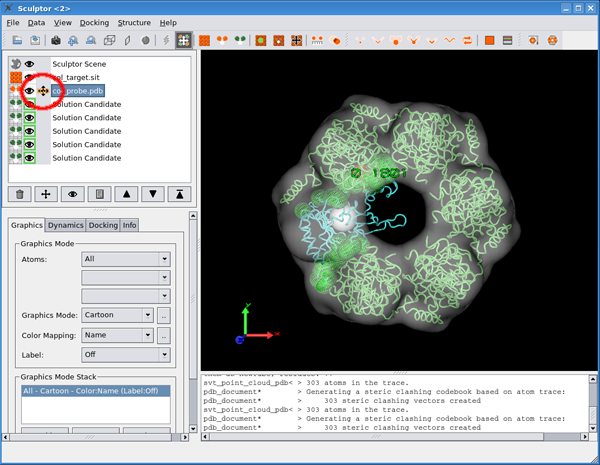
Refining the docking positionsTo move the structure freely, IGD can be turned off via double clicking the move icon:
The IGD display turns off and the structure can be moved freely with the mouse, as usual.
When the move icon is double clicked again, IGD is reactivated and the structure rotates into the orientation determined by the exhaustive search.
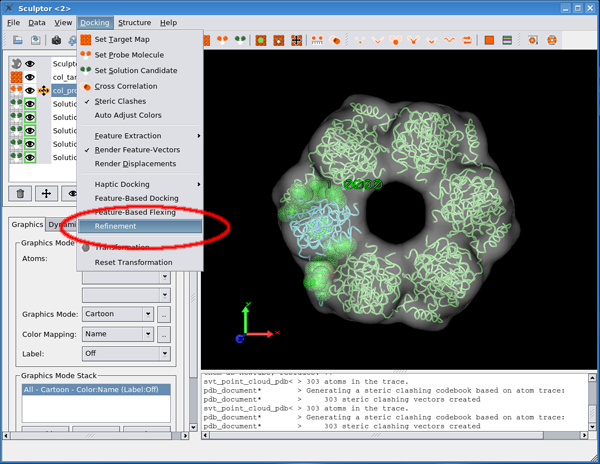
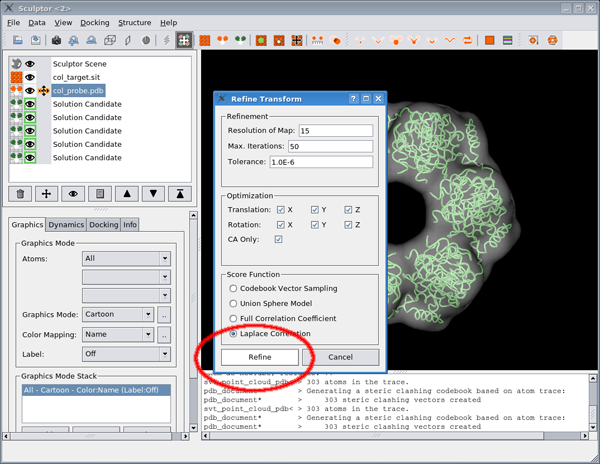
Another refinement option is to use the standard ‘Refinement’ dialog:
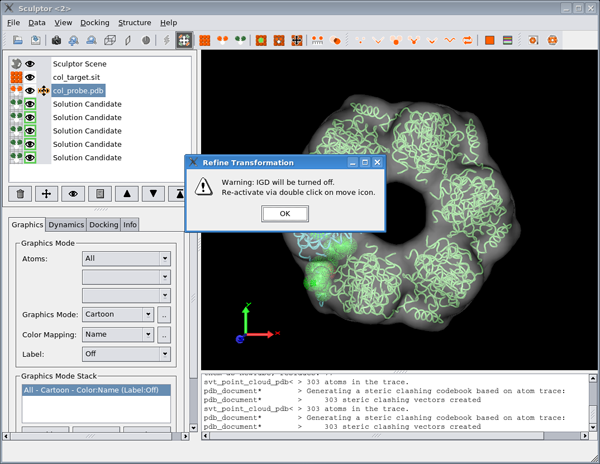
If IGD is turned on when the refinement is performed, Sculptor automatically turns it off and shows a warning with how to reactivate IGD (if so desired).
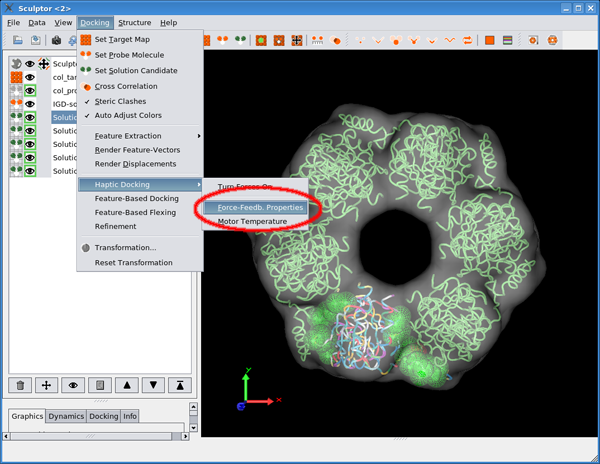
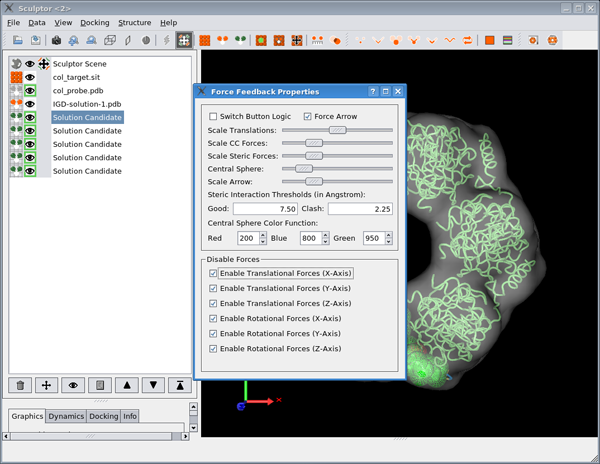
IGD optionsThe behavior of IGD can be influenced via numerous options. To access the options dialog, select “Force Feedback Properties” from the “Haptic Docking” menu or use keyboard shortcut ‘g’:
“Scale Translations” determines how much the probe moves relative to the mouse. A movie of an example session using experimental data
The movie below shows IGD applied to fitting atomic structures of capsid proteins into an experimental map of the coxsackie virus B3 (M strain) at 27A resolution. The volume data set by Hafenstein et al. is available from the EMDB (EMDB-1411). The virus is a member of the picorna family and its icosahedral, non-enveloped shell is approximately 300A in diameter. The capsid is arranged in a T=1 (P=3) lattice which contains 60 copies each of the four viral proteins VP1 (31.4 kDa), VP2 (28.9 kDa), VP3 (26.2 kDa), and VP4 (7.4 kDa). The total weight of the asymmetric unit is 93.8 kDa. An exhaustive search using the PDB structure of the complete asymmetric unit 1COV (Muckelbauer et al., 1995) was performed (Laplacian filtering was used). The movie (recorded in real time) clearly shows the high scoring but incorrect solution in the center of the face and then proceeds to demonstrate the docking of the three subunits in their correct positions using IGD.
Using a haptic deviceIGD fully supports all haptic devices that work with Sculptor. The force feedback is based on the gradient of the CC landscape. Since the probe orientations are set automatically, only the three translational degrees of freedom of the haptic device are used. This also allows the use of inexpensive devices such as the Novint Falcon. User interface features for haptic devices
Using the Novint Falcon
|
